

Data Center Power Usage: How Much Electricity a Facility Draws and Why
US data centers drew about 176 TWh of electricity in 2023, roughly 4.4% of the country's total consumption that year, according to the Congressional Research Service. That top-line figure conceals the distinction that matters for anyone quoting a data center's power draw: the power reaching servers (IT load) and the power the facility pulls from the grid (total facility load) are two different numbers. This page defines both, shows where the electricity goes inside a facility, gives the current efficiency benchmarks, and breaks down typical draw by facility class so a stated MW figure can be read for what it actually is.
TL;DR: The industry's weighted-average PUE has held at 1.54 for six consecutive years, per Uptime Institute's 2025 Global Data Center Survey — meaning the average facility draws about 1.54 W for every watt reaching IT equipment. Hyperscale new-builds target roughly 1.20. Check whether any stated MW figure means IT load or total load before comparing facilities.
What "Data Center Power Usage" Actually Means
Every conversation about a data center's power consumption runs on two numbers, and most public figures blur them. IT load is the electricity delivered to servers, storage and networking equipment inside the racks. Total facility load is everything the building pulls through the utility meter: the IT load plus cooling, power conversion, UPS losses and lighting. When the gap between them averages 54% at the industry level, quoting a "30 MW facility" without saying which figure is meant leaves the reader off by tens of megawatts.
The units matter too:
- MW (megawatt) is a rate: the instantaneous power draw of the facility. A 50 MW facility is drawing 50 MW at any given moment it is at full load.
- MWh (megawatt-hour) is a quantity: energy consumed over time. A facility drawing a steady 50 MW for one hour consumes 50 MWh.
- GWh (gigawatt-hour) and TWh (terawatt-hour) are the scaled-up units used for annual reporting — the 176 TWh US figure is a year of accumulated consumption across all facilities.
One more term: load factor, the ratio of a facility's average draw to its peak draw. A facility sized for 50 MW that averages 35 MW of demand has a load factor of 70%. Data centers typically run high load factors compared with other industrial customers, which is part of why utilities treat them as anchor accounts.
Where the Electricity Goes Inside a Facility
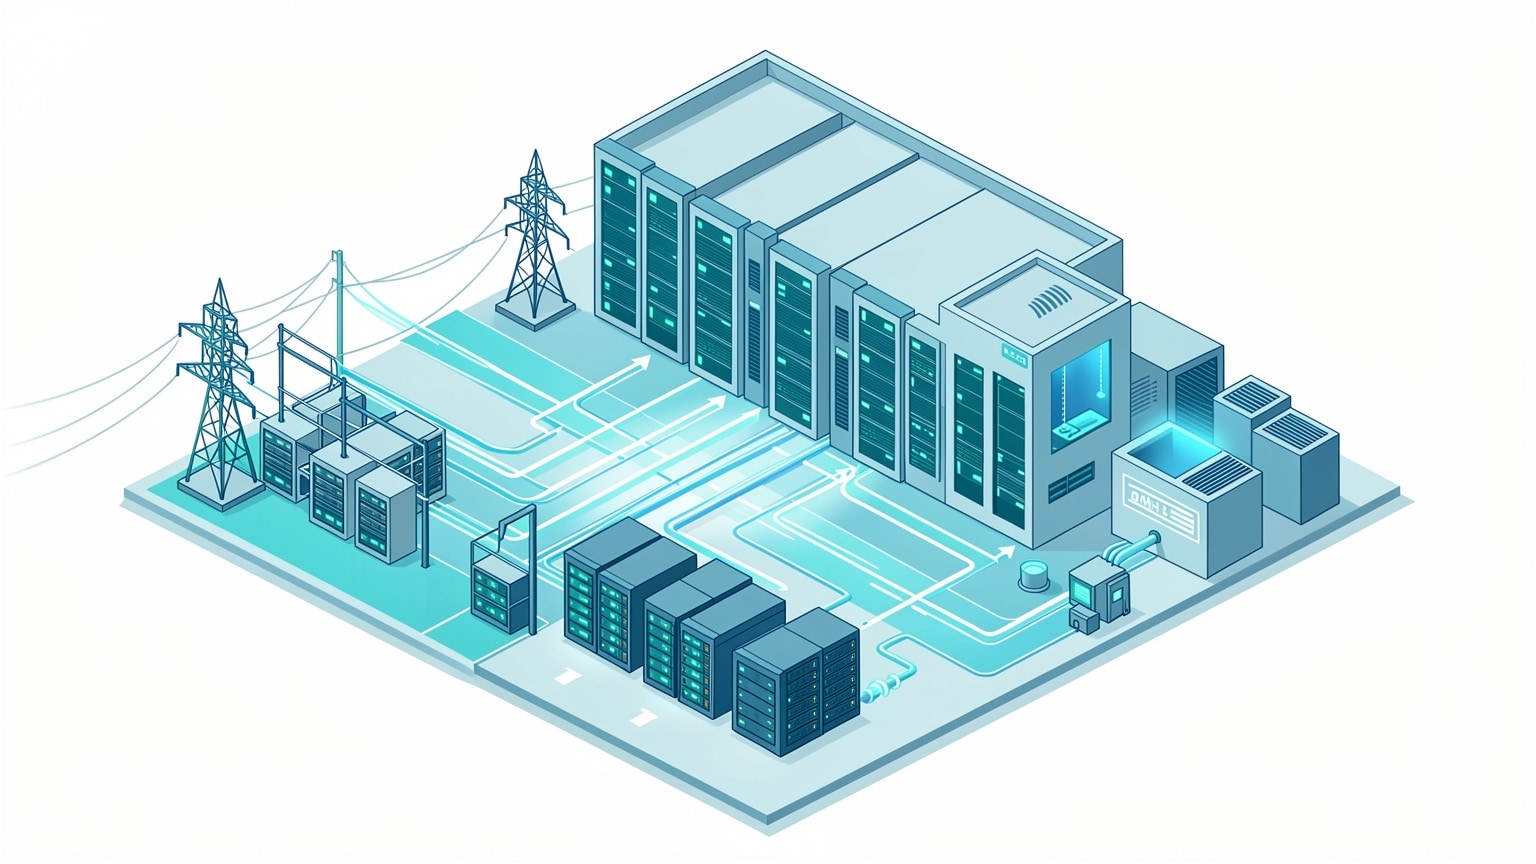
The modern breakdown of a data center's electricity consumption, per industry figures cited by the Congressional Research Service in late 2024: computing and server systems take roughly 40%, cooling systems 38–40%, and network and storage about 10%. The remainder is lost in getting power to the IT equipment in the first place — ENERGY STAR guidance puts electrical distribution losses (through switchgear, transformers and PDUs) at 10% to 12% of total energy consumed, on average.
| Load | Current-era average (2024-cited) | Older-era "average" facility (pre-2011 benchmarking) |
|---|---|---|
| Compute / servers | ~40% | ~30% of rack power |
| Cooling | ~38–40% | Up to 45% |
| Network and storage | ~10% | — |
| Distribution, UPS and other overhead | 10–12% (ENERGY STAR) | Up to 35% combined with networking and cooling overhead |
The older-era figures come from a Cornell University computer science paper drawing on Green Grid-era benchmarking, which also reported average data center energy efficiency of roughly 50% and an industry-average PUE above 2. They describe a facility generation that predates today's hot-aisle containment, free cooling and high-efficiency UPS designs, and should be read as historical, not current.
Two dated but instructive rules of thumb from that same literature frame why the split has shifted:
- About 0.5 W of cooling power was needed to remove the heat from every 1 W of server power — meaning the old average facility spent nearly half its energy fighting its own IT load.
- The average UPS of that era ran at roughly 92% efficiency; modern ENERGY STAR-certified units cut UPS losses 30–55% versus standard models, and eco/bypass modes reduce facility energy costs by roughly 2–8%.
The direction of travel is clear: as mechanical and electrical systems got more efficient, a larger share of each delivered megawatt reached the IT equipment itself, which is exactly what the two columns of the table show.
PUE: The One Number That Ties It Together
Power usage effectiveness (PUE) is the ratio of total facility energy to IT equipment energy. A PUE of 1.0 would mean every watt from the meter reaches a server; the industry has never gotten there. Uptime Institute's 2025 Global Data Center Survey put the global weighted average at 1.54, where it has been stable for six consecutive years. New hyperscale builds target roughly 1.20, while the pre-2011 literature recorded an industry average above 2.
The gap between those numbers is worth money. A facility with a 50 MW IT load draws 60 MW at a PUE of 1.20 and 77 MW at 1.54 — a 17 MW difference. At $70/MWh across a full year of 8,760 hours, that 17 MW gap costs roughly $10.4 million annually in energy spend (17 MW × 8,760 hours × $70/MWh ≈ $10.4M).
That calculation is also why PUE comparisons are treacherous. PUE is self-reported, and the measurement boundary decides the number: a facility that excludes office space, or measures at the UPS output rather than the utility meter, will report a better figure than an identical plant measured at the meter. Before trusting any PUE comparison, ask where the boundary sits and over what time window it was measured — the same facility can report meaningfully different figures in winter and summer.
How Much Power a Facility Draws, by Class
Facility class sets the order of magnitude before anything else does. The Congressional Research Service's definitions put hyperscale facilities at a power draw over 100 MW with at least 5,000 servers and 10,000 sq ft, and note that roughly 100 MW supports the electricity needs of about 80,000 US households; new hyperscale builds range from 100 MW to 1,000 MW.
| Facility class | Typical draw | Scale reference |
|---|---|---|
| Retail / edge | Under 1 MW | A single large retail floor of servers |
| Colocation | 1–50 MW | Multi-tenant halls, metered per tenant |
| Hyperscale | 100 MW and up (CRS definition) | ~80,000 US households per 100 MW; new builds reach 1,000 MW |
Class also determines how the draw is metered and billed: a colocation facility meters each tenant's IT load separately and reconciles against the campus utility meter, while a hyperscale operator reports at campus level. For more on what makes that class distinct architecturally, see hyperscale data centers explained.
How Facilities Measure and Report Their Usage
The authoritative figure for any facility's power usage is the utility meter: that is what gets billed, and it is where total facility load — the PUE numerator — is anchored. Everything inside the building is operational telemetry layered under that meter.
- Utility meter: the total campus draw, billed and auditable. This is the number to ask for when comparing facilities.
- Power distribution units (PDUs): metered PDUs track power usage at the unit and outlet level, and switched PDUs add remote on/off control; a common planning rule is to load no more than about 80% of a PDU's rated capacity, per Weber & Associates.
- BMS and DCIM: the building management system and data center infrastructure management software aggregate PDU, UPS and cooling telemetry into a facility-wide view — the source of most self-reported PUE figures.
The self-reporting caveat from the PUE section applies here in practice: two operators can publish different usage figures for identical facilities because they drew different measurement boundaries. When a vendor or operator quotes a usage number, ask for the boundary (meter-to-server or meter-to-rack), the time window, and whether the figure is IT load or total load. Without those three answers, the number cannot be compared to anything.
What Pushes Data Center Power Usage Up
The demand side is moving, and the movement is concentrated in a few drivers, each of which gets its own treatment elsewhere:
- AI rack density: per data reported by the Congressional Research Service in early 2025, common data-center GPUs of that generation ran 350–700 W TDP versus 150–350 W for comparable CPUs; the newest accelerator generations have since pushed past the top of that range. Either way, GPUs draw several times a CPU's wattage, which changes what a rack — and therefore a facility — draws. The full density story lives in our AI data center power consumption analysis.
- Growth in absolute terms: the IEA's Base Case projects global data center electricity rising from ~415 TWh in 2024 to ~945 TWh by 2030, with the US and China accounting for about 80% of that growth.
- Redundancy topology: an N facility and a 2N facility with the same IT load draw different totals. The trade-offs are covered in our guide to N, N+1 and 2N redundancy.
- Build economics: the PUE gap priced above becomes a build-cost question at scale, treated in our data center cost per megawatt breakdown.
- Where the power comes from: renewables supplied about 27% of data center electricity in the IEA's reporting, with natural gas at about 26% and nuclear about 15%; the IEA projects renewables and nuclear combined reaching roughly 60% of the mix by 2030. On-site and contracted solar and behind-the-meter generation are growing responses — and some utilities, particularly in the Southwest, are moving to require data centers to fund their own generation and transmission rather than spreading the cost across ratepayers, per the Southwest Energy Efficiency Project.
FAQ
How much power does a data center use per square foot or per rack?
There is no single reliable per-square-foot or per-rack average. Rack density varies from roughly 5–10 kW in legacy halls to 50 kW and beyond in AI-optimized facilities, so per-rack figures depend heavily on facility class and build era.
Why do two facilities with the same IT load report different power usage?
Different PUE, driven by cooling design, UPS efficiency and distribution losses — plus different measurement boundaries. A facility reporting 1.20 versus 1.54 on the same 50 MW IT load draws 17 MW more power at the higher figure.
Do data centers draw power 24/7?
Yes. Servers, storage and cooling run continuously, which is why data centers carry high load factors and why utilities treat them as anchor accounts. Unlike an office building, the draw does not fall meaningfully overnight.
For readers sizing a real facility, Zettabyte's TITAN practice designs power, cooling and GPU cluster as one operational system — see the facility-design pages for engagement details.